

If you are a developer, skip this and go learn Java Groovy (or Python) and R. If you are a business user, hr analyst or a manager simply wanting to understand the skills required to get started in HR Analytics, continue below.
There are 3 hurdles ahead for the journey to mastering HR Analytics which often throttle organizational efforts to prove a direct relationship between HR and business financial performance.
- Data Extraction
- Data Transformation / Cleansing
- Data Analysis / Visualization
Any successful strategy must take into account those 3 critical activities in full. In reading the below, one takeaway should be that you cannot run out and hire an HR Analytics lead and expect that role to suddenly deliver all the skills required described here. You need developers with advanced technical skills to get the data out, analysts who know the data inside and out, and strategic program management to piece together a data “story” to be told to stakeholders throughout an organization.
Data Extraction
Getting data out of HRIS and Payroll systems can be an obstacle especially if you want to grab full history for any time period to be analyzed in conjunction with other data. This has become even more difficult with cloud vendors relying on APIs to get to data rather than through traditional methods used in legacy systems. Fuse Analytics offers some cost effective connectors for global SAP (ABAP), PeopleSoft (SQR/SQL), and Workday to enable extraction to CSV in a usable dataset format so that you can start analyzing data on the fly with in-memory tools such as Tableau.
For very basic reporting, any transaction system can provide current data for testing out some of the tools via ad-hoc queries. However, you won’t have the benefits of seeing the changes over time for segments of the population which is one of the most useful views of Analytics (investigating trends).
For more information on Data warehouse and Analytics extraction tools for major HRIS and Payroll systems contact us.
Data Transformation
The tools alone are not going to solve all your issues, but if you are a business user (rather than a developer) a few tools, once mastered, will get you light years ahead of exclusively trying to use Excel. However, in lieu of a significant investment of money expect to need to spend some quality alone time with the tools and documentation to get comfortable…
OpenRefine (formerly GoogleRefine)
https://github.com/OpenRefine
OpenRefine allows you to take in a CSV or text file among other data sources and transform and supplement data to format it into a dataset you can use more easily. As with Excel you can auto populate columns with scripted rules, fill in blank data using other columns or rows, and reformat files with multiple record types mixed into single sources. This works similarly to running Excel macros but the learning curve seems a bit easier to handle if you have some basic scripting knowledge. One of the most useful features is the ability to filter rows on values and apply filling down techniques to populate rows of data where there are blanks. This works well for logs and files where there are multiple record layouts (headers, trailers, etc.) on rows that need to be flattened into usable structures. Its strength is getting less structured files into a structured, tabular format.
You can find intro videos here with examples:
https://github.com/OpenRefine/OpenRefine/wiki/Screencasts
Pentaho Community edition (PDI)
http://community.pentaho.com/
Pentaho is a Visio-like ETL tool for designing data extract and transformation jobs. It provides business users with an interface to build jobs to transform data step by step. The advantage to using this type of tool is that you can save your steps in a job which will reapply the changes in batch to source data when run. This saves many hours of rework in Excel even if you are just doing simple formatting and data manipulation to your sources. Being free/open source you have to expect some finicky functions which don’t seem to run or mysteriously fail, but the nice thing about it is it seems to provide support to many levels of users from report analysts with no development experience to experienced script developers and programmers. The support forums are also active and there are a number of books available to assist with the learning curve. The advantages to the business user are:
- Far less manual rework versus Excel steps since jobs can be saved and repeated over a dataset.
- Very little scripting or development knowledge is required (it can be used in expert mode if desired though).
- Basic joins of multiple tables can be done without knowing any SQL.
Visualizations
Tableau (in-memory visual reporting)
Tableau is not free, but for the price of around 2k per user per year the powerful visualizations it delivers are well worth the expense. You can download a public/free copy to experiment with but note that any reports saved in the public version are saved in a public cloud and therefore you should be careful not to include any company or personal details in the data while testing it out.
http://www.tableau.com/
Some simple ad-hoc examples are shown below using sample data and the public version of Tableau.
Engagement Survey Data
The graph below used a synthesized sample of engagement survey results and plotted engagement versus sentiment score based on employee survey responses. The bottom left quadrant represents employees who are disengaged and also indicated highly negative sentiment in answers. The top right are engaged and positive in their responses.
Geolocation
The below map report was designed to help a company determine the best options to relocate an office. There are 3 categories of points on the map: current office location (HQ), Employees by residence address, and potential new work location (WD). This can easily be enhanced to display multiple potential locations as well as employees by type so that traveling employees like consultants or sales can be excluded from view if needed. There are many applications of geolocation in HR which are introducing exciting new ways of engaging employees, making smarter strategic decisions and enabling more reliable disaster recovery and contingency scenario planning.
Salary and Job Benchmarking
Advanced HR Analytics with R
Once you are comfortable with access and transformation of data using some of the tools above and are ready to take the leap into some real data science applications, there are few platforms as readily available and easy to learn as R programming. The syntax is very forgiving and almost “plain english” in structure.
- Pick your operating system from the link to download and install the platform: https://cran.r-project.org/
- After installing R get R Studio which has helpful tools and a clean development environment with helpful tool tips for getting started: https://www.rstudio.com/products/rstudio/download/
- Spend a few hours dedicated to simple R tutorials on YouTube, there are some great online videos that are helpful to run alongside with some sample data and practice.
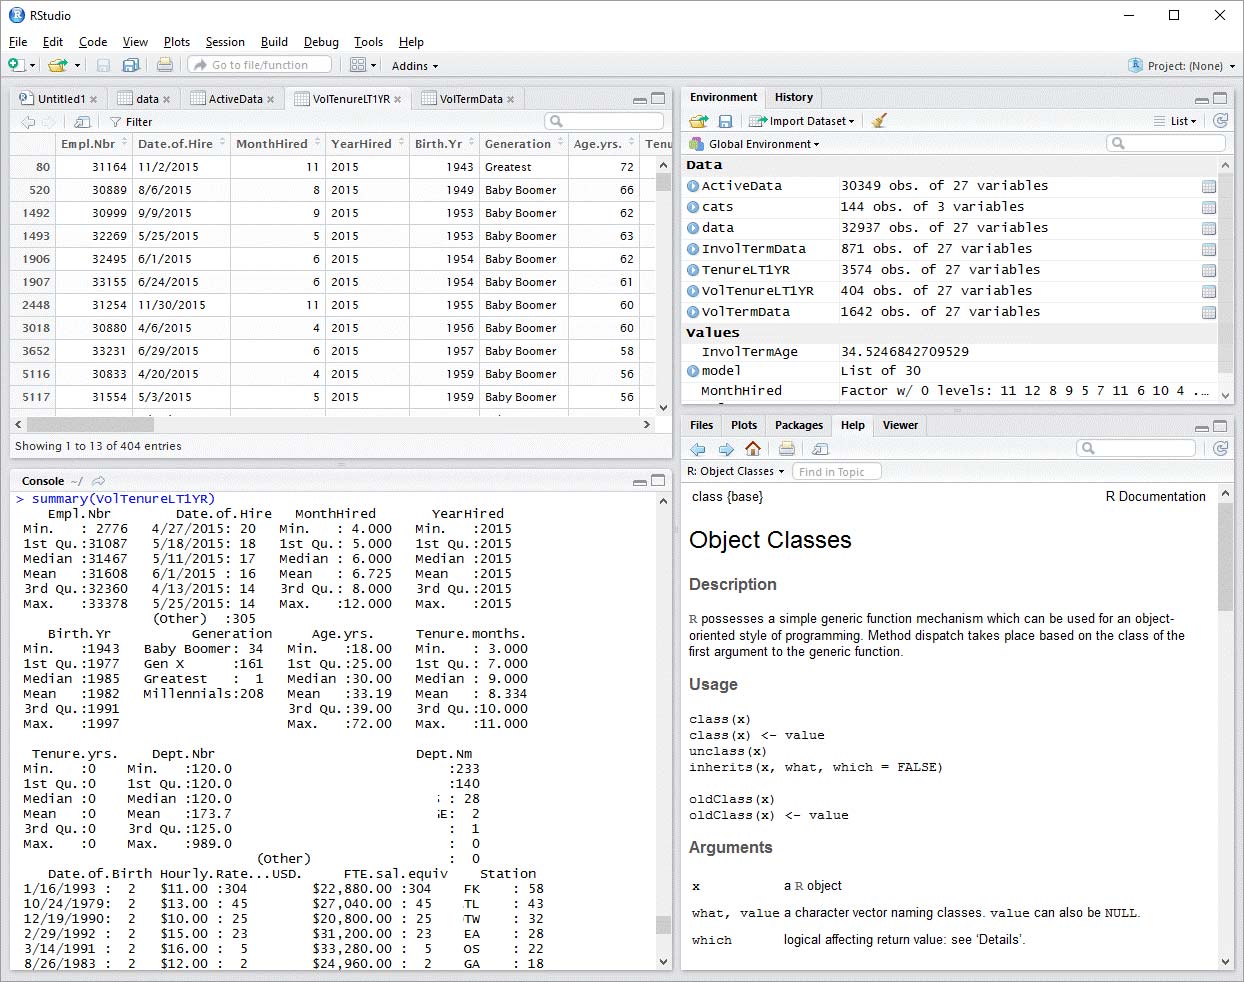
In the example to the left I have imported a dataset for voluntary turnover within 1 year of hire for analysis. After I have imported the data, a simple command:
summary(dataset_name)
…will do the work of a high level analysis for you instantly and picks certain measurement columns and dimensions to assess statistical profile splitting the data into logical groups such as (prepared from my data sample):
Quartile distribution for numeric columns so for example this would tell me at what salary ranges I might have high voluntary turnover.
Counts by dominant factors or dimension/attributes (“work location” for example would be a factor in R) so I can quickly see if voluntary turnover is highly concentrated in factors such as location, employee type, job type or family, age ranges, gender, etc.
R programming gets extremely complex, but with time is easy to master with some knowledge of the statistics behind the logic. Advanced R programming takes you the next level of predictive analytics and data modeling without many constraints on what is possible.
Tying it all together, you can also use Tableau to call R scripts to leverage the advanced visualizations from Tableau to represent the statistical insight produced by your R development for a full stack of tools to meet the most demanding HR Analytics agendas.
Fuse Analytics serves as a common, secure, HR data store that feeds the technology stack above with easy to use, accessible global HR data models (standard and customizable) for a fast return on investment in HR Analytics. We specialize in HR data extraction and integration from major packages such as SAP R3, PeopleSoft, Workday, and SuccessFactors to get you moving quickly in HR Analytics.