
Operational versus Strategic Reporting
We often talk with clients struggling to make sense of the shift from operational “reporting” to Analytics. Many clients still stuck in transaction reporting mode have a difficult time seeing how truly transformational Analytic/Strategic reporting can be for HR. To complicate matters, most legacy tools are not built for anything except transactional reporting.
Operational Reporting is often only transactional in nature. It answers questions like, “how many full time heads do I have in my organization today?”. Transactional reporting often has the following characteristics:
- Limited to small time scale or points-in-time (today, this month, this year, last year).
- Volume often is limited enough to read in table format only, less graphical representation needed.
- Often limited to data 0-3 years in age on average.
- Includes most compliance reporting.
- Static output (basic sort and total functionality if you are lucky).

Operational Reporting is most often best served real-time from transactional source systems due to to the detail required and time sensitivity in data.
Strategic Reporting is often characterized as Analytics. It answers questions such as, “how has my headcount fluctuated (and in what areas) across my organization during the past 3+ years”. Analytics permit a user to:
- View consolidated data points across a timeline (ex: 2009-2013).
- Due to the high volume- often has to be presented graphically.
- Often accesses data 1-10+ years in age.
- Helps identify correlated trends over past time periods.
- Supports estimates or forecast probability (prediction) of future trends for planning.
- Output is often dynamic and interactive.
- By nature can be less time-sensitive.
Analytics let you see the “forest”, transactional reporting lets you see the “trees”.
Metrics
A metric, or a fact is a specific data point:
– turnover % (heads terminated/total [active] heads)
– revenue per person (total $/total heads)
– ratio of HR administrators to Employees (total HR employee heads: total heads)

The above represents the number of employees who voluntarily left the organization during a the time period selected.
While facts are always open to interpretation, the actual calculation of a fact should be a fixed measurement charted over time for different segments of an organization. They can be absolute counts, percentages, ratios, or any other mathematical measure.
Metrics or facts are also often synonymous with “KPIs“ ( Key Performance Indicators ).
Analytics
Analytics generally refer to the measurement and reporting of metrics (often presented visually) over time as they relate to one another. Although this realm grows extremely complex in areas such as quantitative risk analysis, often used in financial services, for the purposes of Human Resources we only need to get familiar with some basic concepts:
correlation (can be a Positive or Negative relationship): in a sample set of data with 2 groups, this is the strength with which the 2 groups relate to one another on some metric across time. Graphically, a positive relationship is demonstrated by 2 lines moving in parallel across time – as one metric goes up the other goes up (as seen below) and vice versa.

The above displays the number of voluntary leavers graphed alongside the involuntary terminations for a time period.
inverse correlation (also called a Negative Correlation): in a sample set of data with 2 groups, this is the strength with which the two metrics are opposed to one another, moving in opposite directions. Graphically this relationship is demonstrated by 2 lines moving in opposite directions across time – as one metric goes up the other goes down, like an “X”.
time series: a block of data points for a defined time period (for a specific metric or fact) which, in the Human Resources domain, is typically represented by a monthly, quarterly, 6-month, or annual period. This permits an analytics engine to compare a metric over different time periods to check for correlations or inverse correlations. It also enables software to perform predictive analytics on future metrics based on actual historical data. See the time series graphic below.
Predictive Analytics
regression modeling: A regression model simulates probable outcomes of a particular metric based on other correlated metrics or variables. For example, I may want to predict (assuming there is a correlation) probable turnover in the next 6 months based on an increase in the absence rate over the past 6 months.
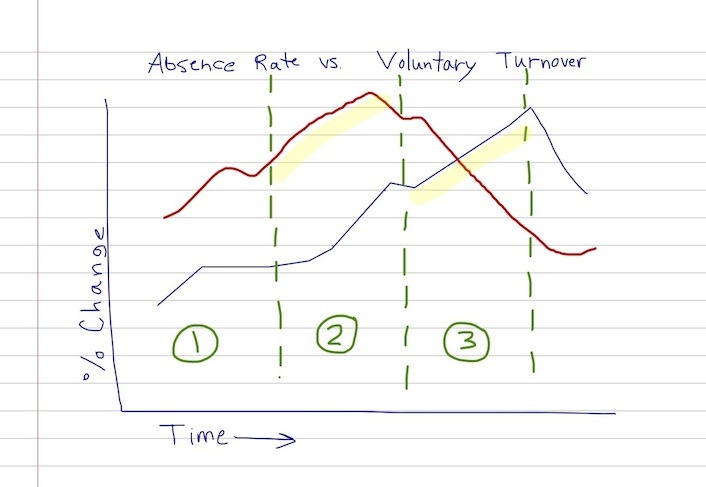
In the graph above, the time period is subdivided into 3 series to compare each period to the others to check for a relationship between the two metrics (1-versus-2, 1-versus-3, and 2-versus-3). The faint yellow shading highlights a seemingly strong positive relationship between absence rate increase in the 6 months of segment number ‘2’ and the voluntary leaver rate in segment number ‘3’. Meaning, an increase in absences may be pointing to future increased employee departures over the next 6 months.
These can be further broken out into the different time periods described above (3, 6, 12 month segments) for a more detailed analysis of positive or negative relationships (correlations). These confirmed relationships are then used to estimate probable future outcomes based on data currently available for regression modeling. Regression models can get far more complicated where data is available, but in Human Resources companies are mostly limited to the typical scope of HRIS data which does not currently enable highly complex models like those which may be more frequently leveraged in Financial applications.
There are many methods for performing regression analysis or “predictive” analytics- a few commonly cited methods are:
- Naive Bayes
- SVM (Support Vector Machine)
- Random Forests
Keep an eye out for our upcoming post on predictive analytics explaining how some of the above methods work for a better understanding of the uses and limitations.
Key Performance Indicators (KPIs)
Human Resources departments are rapidly improving their strategic reporting through the development of measurements that might have seemed impossible only a few years ago. Some of the key measurements traditionally leveraged in HR in the past:
- Headcount
- # New Hires
- # Terminations
- Turnover Rate
However, additional example metrics can now include:
- commute times
- number of salary changes, title changes (organizational/career mobility)
- average variance from average salary survey min, max, and mean
- unstructured performance review, engagement and culture survey data
- natural language text analysis
Web-based SaaS software acceptance is enabling the use of an expanse of data that resides outside the typical HRIS. The major drivers are:
As a result, companies can make use of data that was previously prohibitive to collect and synthesize. We are now able to incorporate social networking, geographic, and labor market data freely available across the web to find and retain the best talent.
At Fuse Analytics, we are pushing the limits of these new analytic capabilities in Human Resources. We help you transform the HR function into a strategic business partner by consolidating your HRIS applications and harvesting external data to provide an easy-to-use, 360-degree view under a single global reporting platform. Contact us at info@fuseanalytics.com to request a demo or learn more.
Ready to get started? This next blog post will explain the tools and processes that go into getting your feet wet in HR Analytics