
If it isn’t broken…
Don’t fix it… but how do you know if your culture is broken? What do you do even if you know it is? Where Workforce Analytics meets traditional Organizational Dynamics often can be the roadmap to improving your culture, diversity and in turn productivity and profitability.
Historically the pulse of an organization was difficult to measure to a useful degree. That has changed due to advances in technology, proliferation of data, and HR job specialization and internal re-evaluation of employee career objectives.
If your organization has been delaying a big data initiative for HR this is a good first step in discovering what it can reveal.

Surveying data across organizational and people dimensions allow breaking down of the population more easily. This leads to real actionable insights when coupled with Workforce metrics by the same dimensions.
Satisfaction vs. Engagement vs. Sentiment
While these are all undoubtedly correlated measures, it’s important to understand the nuances of these words in the context of surveys:
- Satisfaction is a term lifted from “customer satisfaction” but is most often synonymous with Engagement when applied to employees. However, it’s important to recognize that the words do matter so it is important to maintain a a consistent label between the two.
- Sentiment refers to the degree of negative and positive emotions connected to an answer. Sentiment is NOT the same as Engagement and you can have employees who actually perform better when engaged but are not “positive”. One can be engaged as a pessimist and can be disengaged as an optimist but these do tend to correlate on average.
- Engagement is the relatively newly coined term most companies seem to want to tie back to voluntary turnover metrics.
Culture
Culture is a critical component of any successful organization and transforming it takes a huge amount of change management time and effort. More challenging is quantifying what “culture” means to an organization and measuring shifts in those measures across social, geographic, economic, technical, legal, structural, strategic and operational lines.
Certain organizational norms (as with people) can make them unproductive and difficult to interact with. This leads to high turnover and significant losses in productivity due to increased absences, little knowledge transfer, and lack of motivation. There are new and better ways to effectively measure these shifts that did not exist before.
Culture can be either a growing cancer or the lifeblood of a company. Early detection is critical in this case as well, the incline in organizational health takes years of effort, but it can take a steep dive in only months. Areas of your organization which have negative sentiment and low morale will spread to closely connected segments easily by geography, job function, and reporting lines.
Culture health has direct correlations to turnover, productivity and profitability.
Measuring culture is as much art as it is science, but the most important part of measuring is creating a standard yardstick. Without this baseline it’s difficult to know where you stand as an organization.
Text Analysis and language heavily influence cultural profiles and therefore the questions and content are usually difficult to translate into multiple languages. The best approach is to keep phrasing as simple as possible and do not underestimate the need for professional translation which can be highly subjective.
We leverage a model which was developed from a cultural model designed for measuring broad cross-country cultural business differences and was adapted to include more person-centric components as well (similar to the one covered here): http://blogs.hbr.org/2014/04/a-tool-that-maps-out-cultural-differences/.
This was also built with concepts covered by John Kotter in his book Organizational Dynamics Diagnosis and Interventions https://www.amazon.com/Organizational-Dynamics-Diagnosis-Intervention-Development/dp/0201038900
Based on the questions answered in our survey and more free word-association included we convert the results into two parts:
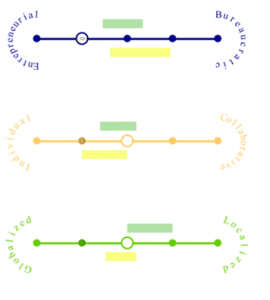
- A scale based on a continuum of typically opposing (but not mutually exclusive) dimensions of culture (e.g. ‘entrepreneurial’ vs ‘bureaucratic’).
- A word associated text analysis that correlates engagement to particular organizational traits described on the scale
They are represented as a Word bubble below, Engaged vs Disengaged Word usage, and the derived Culture Continuum scale:


Survey Anatomy
If there are 50 questions on a survey, compiling data and finding all these relationships and then tracking changes to responses over time takes a tremendous amount of manual time and effort. Many companies may disregard the work as unnecessary expense or not high visibility enough to warrant funding on a long term basis. However, there is much to be gained in organization dynamics and productivity improvement for most organizations. Delving into the details can reveal some interesting characteristics introduced below.
Standard Deviation
A well rounded survey question may have a mean response of 50% of the total scale (for example, 2.5 on a scale of 1 to 5). Each question will also have “volatility” characteristics indicating how widely answers vary on the scale. In addition, each question will often have negative or positive emotional correlations as well as correlations to other questions or keywords.
A low volatility (standard deviation) for certain questions indicates similarity in all answers. Take the following example:
- the (1 to 5 scaled) agree/disagree statement being evaluated is “Colleagues come and go often, very few co-workers have been in my group or company over 5 years.”
- the sample survey resulted in an average/mean of the answers of 2.9, very close to the 2.5 midpoint and the standard deviation was 1.38. This indicates answers varied widely (almost across the whole scale of 1-5 and were very volatile).
Assume in year 2 we ask the same question and now the average answer is 2.5 and the standard deviation goes from 1.38 to 1. What this may indicate (with further investigation into turnover rate for certain segments of the population) is that people are starting to agree more uniformly with this statement. Obviously this is not a healthy shift in opinion because it may mean people feel turnover has increased (whether it has or not in reality). What people feel is as important as the hard metrics you see in workforce analytics if not more so.
There were correlations between turnover and sentiment/engagement established to be considered. Of course not everyone who is not engaged quits, but nearly everyone who quits is not engaged barring unexpected external events. The objective however, is to combine this metric with other key metrics such as performance. Those dissatisfied employees who do not quit may be causing you more undetectable harm in lost productivity and morale reduction without actions taken to improve assessment metrics. Culture is contagious.
Unhappy and unsatisfied employees may be spreading this culture throughout the organization leading to losses in productivity, high turnover, shorter tenures, and erosion of profitability. You lose about 34 cents for every $1 paid to disengaged employees and potentially those in close proximity to them.
To scale or not to scale
While the above was studied on a number scale which is effective at detailing trends in reporting, recent versions were converted to True/ False which brings the response time down to less than 5 minutes versus 5-10 minutes with a full scale which helps with higher response rates.
The value from a numeric scale versus a true /false boolean scale may have limited value statistically if you don’t get a high response rate and/or you only have a couple of thousand employees versus ~2500 and upward.
In the below example of data from the question, “I have clear career path options…” you can see the answers depend on job function and Age range but you lose little converting to a ‘True’ or ‘False’ unless you plan to measure the distance between Agree and Disagree there is little value. A simple True/False would convey most of the same information, that IT department jobs for older employees in the Boomer and Gen X groups don’t convey much confidence in having a “long term career” in your organization for better or worse. It could however be interesting to you to compare IT to HR seeing that HR seems to be doing a better job potentially at retaining the Gen X group employees.

● This shows a few of the 8-10 dimensions across which the responses are modeled. ● The yellow and green bars represent the 90% average range (confidence interval) of engaged (green) and disengaged employees(yellow) across the entire population. ● The white circle represents the sample population mean/average ● The smaller, gray circle represents the entire population mean/average. |
A True/False format is also easier for respondents to answer in various formats such as chats, mobile devices in addition to traditional desktop access.
A true / false format can also better enable automated AI and Machine learning analysis in raw form. If you have less than ~2000 respondents in your target audience it may be better to stick with the True / False formats.
Engagement and Sentiment
What does an “engaged” employee look like? Here’s how we conducted our sample survey and what information the results convey…
http://public.tableausoftware.com/views/Engagement_survey/Sheet1?:embed=y&:display_count=no

While Sentiment and Engagement trend together, it is possible and normal to find results that show a “happy” sentiment but to not be engaged in the work or culture and it is also possible to be “unhappy” in sentiment but be engaged. In fact some job functions have been known to work well with the inverse being true!.
See References below*
We were fortunate enough to have captured pre-resignations and to be able to conduct a few exit interviews during the initial evaluation period which helped calibrate the scale.
Try the survey here; or the text/chat version in the pop-up to the right ->
Key Takeaways
- Based on our sample survey only about 50% of respondents’ answers indicated they were engaged and reflected positive sentiment (upper right quadrant). This leaves a lot of room for improvement in the average organization!
- Other surveys have resulted in dissatisfaction (or lack of engagement) on average as high as 75%. This has likely contributed to the mass post-COVID resignation volumes in the market as of today and a drop in labor availability.
- Social demographics matter– answers ranged widely on some questions by age group even within the same job function.
- A 50+ question survey is not necessary to establish engagement alone. In fact, a small, succinct, well calibrated set will achieve better response rates and can help quantify tectonic shifts in culture and subcultures of an organization. In our study only 6 of 50 questions were correlated to a control, self engagement score. The remainder are left primarily to assess more complex dimensions of culture
- Questions don’t necessarily need a complex scale of 1 to 5 or more especially if your target group of respondents is relatively small and your budget limited. True / False can be 80-90% as effective at a fraction of the analysis efforts while achieving higher completion rates..
Opportunities are exponential in big data because data about data often generates further and sometimes even more interesting insights. Holistic analysis of culture, communication and engagement presents one of those exciting and relatively unexplored frontiers of organizational dynamics which can potentially alter your organization drastically to improve productivity; and of course profitability.
References
http://blogs.hbr.org/2014/04/a-tool-that-maps-out-cultural-differences/
https://www.amazon.com/Organizational-Dynamics-Diagnosis-Intervention-Development/dp/0201038900
https://hbr.org/2017/03/does-work-make-you-happy-evidence-from-the-world-happiness-report
https://opensourcedworkplace.com/news/job-satisfaction-vs-job-performance-609238833
https://en.wikipedia.org/wiki/Hofstede%27s_cultural_dimensions_theory